Last month, the CEO of Rheinmetall, Germany’s biggest arms manufacturer, dismissed drone makers in Ukraine as being “Ukrainian housewives”, saying they have 3D printers in their kitchen and make parts for drones. This is supposed to contrast with the exquisite systems produced with German engineering that he can offer.
There is a big problem with these exquisite systems though: they have a price tag to match. For a job like explosive ordnance disposal where robots provide an extra life to the EOD operator, having a very expensive robot means needing to take precautions to safeguard it from harm. The more risk averse you are to losing a robot, the more risk tolerant you have to be of losing a person, which defeats the purpose. Expensive robots need to be protected because you only have one. What we need is cheap robots so that we can tolerate more risk with them.
Imagine this: an RC car with a mounting plate on top which allows you to bolt on accessories like cameras, a simple arm, a disruptor, etc. You could have a 3D printed water disruptor screwed on top at the right angle without needing to pay for a remotely operated robot arm. You could place disposal charges by just driving up to it, or test for magnetic influence switching by doing a drive-by with a magnet. Maybe you strap a cheap WiFi band jammer to counter an RC threat from a downed drone. If you lose your RC car, that’s fine, it cost a couple of hundred at most and you have more of them.
This RC car is very cheap and perfectly capable of the simple tasks we require of EOD robots most of the time. But there is actually another advantage which the Ukrainian housewives have over Rheinmetall that we could capture: in-house design and iteration. Right now, our exquisite systems do whatever the procurement contract said they should do plus whatever the manufacturer thought was a good idea at the time of design. If you want the robot to do something different, wait until the current one is obsolete and then a bit more for your organisation to find a replacement.
If disposable robots were made in-house, we could iterate our capabilities at the pace at which we could design them. Most of what we need is primary school level mechatronics and if we happened to have a robotics whizz then we can go even further. I recognise that this creates a training burden on a unit to be able to develop robotics parts but I would say that understanding the digital electronics and mechanical requirements is a highly useful skill to EOD operators regardless.
The expensive systems with incredible capabilities absolutely have their place. The price tag really does buy you something. In a world with incredibly cheap but capable explosive threats, rolling the dice with your one fancy robot on every job is eventually going to come back to bite you. If you have no more robots then you will have to go manual and going manual is dumb.
Not everything is easy to see. Some things are actively trying to hide whilst others are just hard or impossible to see with the naked eye. What we would like is a tool that enhances our ability to see beyond the visible spectrum. Even better if we can recognise what it is we are looking at.
Thermal optics do that by allowing us to see into the infrared part of the spectrum. By treating everything like a black body, we can even estimate the temperature of different things that are being imaged and highlight things like humans for ease of recognition. Often to do that we sacrifice the visual spectrum or have to superimpose it with a fused view.
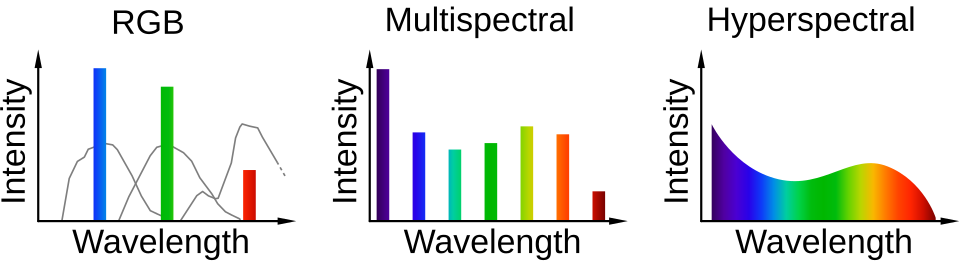
Hyperspectral imaging (HSI) goes several steps further. Where a normal camera would give you how much red, green, and blue are in each pixel in an image, and an IR camera might give you some channels in the infrared, HSI gives you detail into the whole spectrum of its range down to bands of a few nanometres.
This phenomenal amount of data means you have what is essentially an FTIR spectrum (like you would get from a commonly used TruDefender from Thermofisher) for each pixel in an image. Much like you would use an FTIR spectrum, that means you can start to understand the material of anything you image with a HSI system.
For the CBRNE world that means a few things. First, we might be able to use them to detect things that are camouflaged in the visible part of the spectrum. The famous Houthi roadside IEDs that were hidden as rocks would have a wildly different spectral fingerprint compared to a real rock. I have never scanned a rock, but it strikes me as the kind of thing with different functional groups to the polyurethane of expanding foam. The right kind of anomaly detection algorithm would make detecting those very easy.
For a vehicle travelling along a road, the outside of these “rock” IEDs are pretty hard to distinguish from regular rocks. Pairing them with PIR sensors made them dangerous to route search for also.
The second that comes to mind is chemical detection. Right now we lack the tools to effectively recognise where gaseous chemicals have spread to without putting detectors in various places and estimating the gaps inbetween. With a hyperspectral camera it is straightforward to identify gases based on their hyperspectral fingerprint from a distance, with the usual proviso that they have IR-active groups in the bands being measured.
This would mean HAZMAT jobs with a gaseous contaminant have to do less guess work when it comes to how they are containing and venting things, or how far a particular gas has spread. Plotting a downwind hazard after a release goes from a guess to quantifiable amount with a UAS-mounted HSI.
This is an image from a Hyspex camera detecting methane emissions, colourised red. Methane is invisible to the naked eye and not actually red.
The spectral fingerprinting I have described here is a feature of hyperspectral imaging. It is worth contrasting this with multispectral imaging which still gives some insight into the spectrum past the visible portion by showing bands of infrared. Much less study has gone into whether or not multispectral cameras are “good enough” for the purposes I have discussed above and it is worth a shot to investigate if it means more people can get access to seeing in infrared.
There is already a huge jump in information from a regular RGB camera to a multispectral one. Hyperspectral is needed to really understand the continuous spectrum.
Next time, we will have a look at what imaging systems have been studied for the kinds of defence applications discussed here. Whilst I hope I have painted a hopeful picture for the technology, and a lot of work has been done to show its efficacy right now, for CBRNE there are still a lot of employment questions left to be tackled.
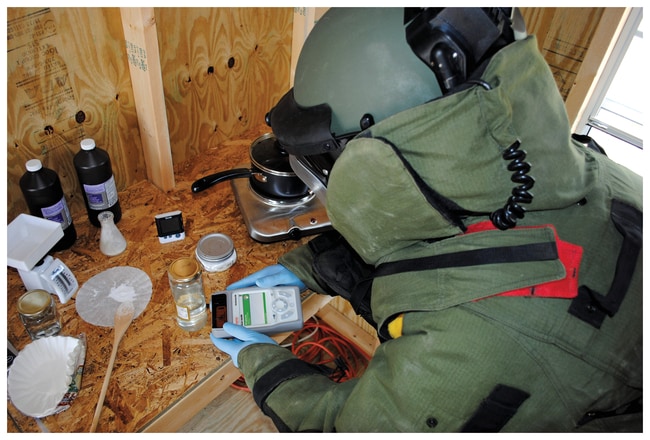
If you ever come across a lab where people leave unlabelled products on a table, you may wonder what exactly it is you have found. Some things have a distinctive colour, smell, texture, but an annoyingly large number of them are white crystalline powders.
So how do you answer the question “what is this?” I find that kind of measurement/sensor/detector technology to be endlessly fascinating. When it comes to figuring out what a substance is, the tests all revolve around figuring out some kind of feature of the substance that we can recognise. That is really vague because the tests are more vague than we sometimes give them credit for.
A Fourier-Transfer Infrared (FTIR) based detector looks for functional groups of a substance. A gas chromatography one compares elution times which is a proxy for volatility in the gas phase. A mass spectrometer will try and identify base on the mass of fragments. A colorimetric test will usually use the target substance as a catalyst for a colour-change reaction.
These kinds of detectors are used to search for explosive devices by the military, but they actually cannot detect explosives at all. They detect metal and we hope that the explosive device has some metal content.
What we would love is a rugged handheld device which we could point at anything and it could tell us what it is, regardless of its purity or nature, without destroying it, to a perfect degree of sensitivity and specificity. Certain detectors – like a Raman spectrometer – do approximate that, as long as it not a dark energetic, or too much of a mixture, or Raman inactive, and you don’t care about isotopes, etc. But even a Raman spectrum does not actually give a readout of what a substance is, it merely tells you about its (Raman active) bonds and then the library will guess as to what the molecule is. This library step can mislead the end user into believing that a Raman test is more confirmatory than it really is.
ThermoFisher’s Raman spectrometer shown here scanning through a glass jar at an unknown liquid.
Even if we separate our substance for purity with some kind of chromatography, get an IR spectrum to identify functional groups and a mass spectrum to identify the mass fragments, we would still not be able to distinguish confidently between isomers of compounds in all cases. These techniques ignore stereochemistry, which can be really important: the famous medication thalidomide had one isomer which helped against morning sickness and the other gave babies birth defects. The difference was the arrangement of the molecule.
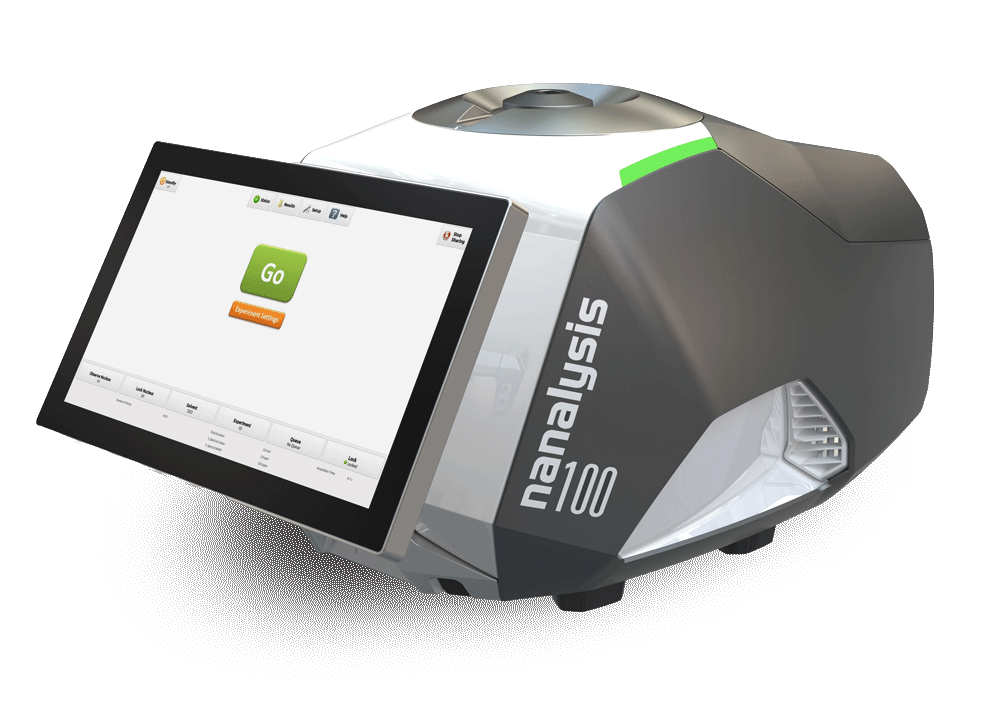
This is a benchtop NMR machine, the most portable version of the kind of tool you would need to identify the stereochemistry of a molecule. Typical lab-grade ones can occupy whole rooms.
The good news is that you very rarely need to know everything about a substance. Sometimes you only care if it is energetic. You may want to check for the presence of blood or a narcotic. Maybe you only care about whether or not you can breathe in a certain environment by checking for certain poisonous gases and oxygen. Being specific about what you want a detector to do is important in selecting the right tool and you then have to be conscious of its limitations.
The Raman spectrometer mentioned before will continue to be a go-to for me, even though I can’t really sample gases effectively, and it can detonate dark energetic compounds, and it cannot see metals, or ionic acids like hydrochloric acid…I need it to be able to identify explosives, ideally without touching them, and the kinds of covalent bonds that explosives have are typically Raman active. If a trace amount of darker powder detonates, then I basically have the answer I need anyway.
Your use case may be different in terms of the scope of compounds, the safety requirements, or the forensic sensitivity involved. It is important that you determine your needs carefully and then select the tool that best approximately what you do.
PS: the header image is from an online advert for “white crystalline powder”, which is apparently lab grade and very pure. Unfortunately, it has no information on what it actually is so a few of these techniques would be in order.
Safety calculations for different kinds of hazards involve a bit of maths that are quite intuitive if you know where they come from and seem arbitrary otherwise. In this post, we will explain where inverse square laws and inverse cube laws come from to develop that gut instinct for how far you should be from blast, radiation, etc.
The most important thing to understand in order to appreciate the distance dependence of a safety rule is how the hazard spreads. For instance, a high explosive generates a lot of hot, compressed gases that expand rapidly to form blast. These gases expand in a volume, and volume is in distance cubed (eg metres\(^{3}\)), so the safety law is associated with an inverse cube law.
When we are dealing with radioactive sources we have an inverse square law because the radioactive emissions do not fill up a volume, they instead spread out in all directions like the light from a bulb. This forms a surface with area units (eg metres\(^{2}\)).
Compare the light from the light bulb – which behaves like a radiation source – to the gases from an explosion which carry the blast:
Now I appreciate that this picture is not exactly life-like, but I hope it illustrates the different way that the explosion gases expand to fill the space compared to the spread of light over a surface area. To get the inverse part of these laws we consider that the effect is spread over the area/volume.
Explosion occurs -> hot detonation gases spread outwards in all directions -> spread in a volume of \(\frac{4}{3} \pi r^{3} \), or in other words, all the gases are spread throughout the sphere means \(\frac{1}{\frac{4}{3} \pi r^{3}} \). The \(\frac{4}{3} \pi \) is just a constant, the important bit is that the safety distance will be described by a factor of \(\frac{1}{ r^{3}} \).
Radiation source emits -> radiation spreads outwards in all directions -> spread across the surface of a sphere -> \(\frac{1}{4 \pi r^{2}} \). Of course, with radiation the source is constantly emitting so that gives us a dose rate per second. To state the obvious, that is why distance, shielding, and time are mitigations for radiation whereas only distance and shielding help with blast.
So what about fragmentation distances? Fragmentation would spread evenly in all directions much like radiation and so form a “surface”, so you would think that it would have an inverse square law. In fact, in outer space it would do. On earth the limiting factor to the inverse square law for frag is that gravity drags it to the ground so it does not travel straight, and air drag slows it down so it does not travel forever. So for very close distances, fragmentation hazard distances are an inverse square law, but at the kinds of distances we care about to be safe, a more complicated relationship holds.
When we picture how explosives do work, we often picture blast propagation passing through the material in a nice linear way. Of course, we recognise that some of the gas products are exiting at the sides, but we typically do not try and account for these losses in our calculations of explosive effects.
For an unconfined explosive, these gases escaping to the sides are doing no work on the target and hence they need to be discounted for a precise understanding of the effects. Fortunately the experiments have already been done and it turns out that that there is a “cone” of effective explosive mass of 60°. What this means is that the configuration of explosives make a big difference: stack too high or too wide and you may be wasting explosive. The figures below show two cases of unconfined explosive driving a flyer plate:
Figures are from Explosives Engineering by Paul W. Cooper.
In the figure on the left, there is a thick layer of sheet explosive which exceeds the cone (or triangle in this 2D image) of effective explosive mass labelled \( C_{e} \). On the right, the explosive is not thick enough to create the maximum possible effective charge mass and is instead a truncated cone.
The obvious takeaway of this is to shape charges in such a way that best approximates this effective charge cone or to confine the explosives such that there are minimal side losses.
The best practice when x-raying a suspect item is to get all the angles: back to front (A-C), side to side (B-D), top to bottom (E-F) shots. Sometimes these shots are hard or impossible to get safely and it is important to ask: what information can we get if we stick to only an A-C shot? Is it enough to get spatial resolution inside the item? Spoiler: yes.
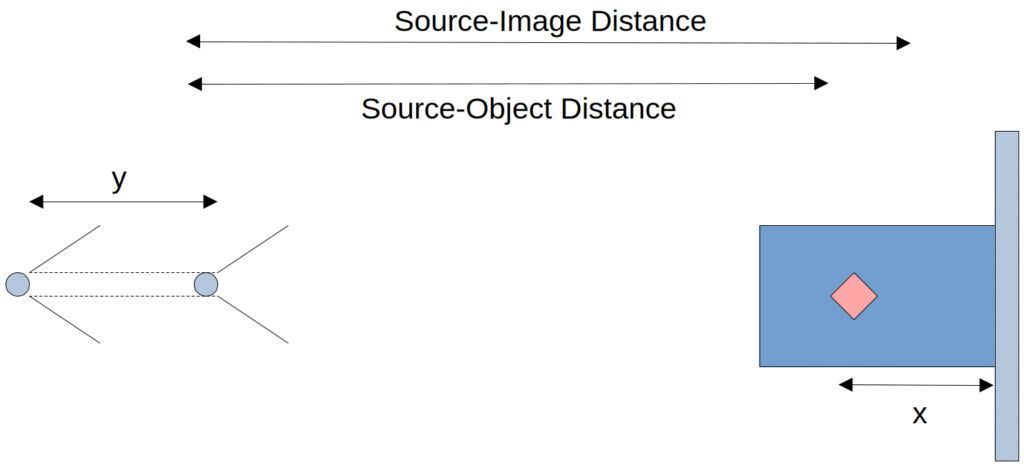
Here is the constraint for this scenario: you have an item that for whatever reason you can only get one angle on. You can move the x-ray panel or source in between shots, but only in the same plane. For the purposes of this scenario, I will be moving the source rather than the panel.
An x-ray image is a 2D representation of the object but it does actually have part of the 3D information because the distance between the panel and the object creates magnification. The magnification factor is equal to the source-imager (or panel) distance (SID) divided by the source-object distance (SOD):
\( M = \frac{\text{Relative Size}}{\text{Actual Size}} = \frac{\text{SID}}{\text{SOD}} \)
If we are trying to figure out where along the length of that axis an item like a 9V battery is, we can use the known actual size and the magnification factor to determine where inside the item the 9V battery is. This should be relatively clear to people who have played around with x-rays: things that appear larger than they should be are further away from the panel (and closer to the x-ray source).
The bit that may be more surprising is that we can also figure out where an item is when we do not know what the actual size is by moving the source and hence changing the magnification factor. The derivation is a little bit messy but the process is simple for taking the x-ray. First, take an image where the source is closer than you would normally take it and the panel is in a typical position. Note this source-image distance down. Move the source back a set distance (we will call it y) and take another image.
Diagram of our x-ray setup with the source on the left and a box (blue) with our hidden object (pink) a distance x away from the image plate.
The two images you have will have different magnification factors for the object we are trying to locate along the axis of the shot. Measure these in your x-ray software. We can then use the expression we had before for magnification factors and take the ratio, noting that our SID and SOD are changing by the distance y:
We could solve this expression for SOD to find where the object we are looking for is inside the item, but a more useful value x will be easier to work with, where x is the distance from the panel to the object. Given that the panel will typically be right next to the object, x is an easier distance to measure. Noting that \(\text{SID} = \text{SOD} + x \), we can re-arrange the expression above as:
With a bit more rearranging of equations, and using the relative size we measured earlier in images 1, 2 (\(\text{Rel}_{1,2}\)):
\( x = \frac{(\text{SID}+y)(1-\frac{\text{Rel}_{2}}{\text{Rel}_{1}})}{\frac{y}{\text{SID}}+(1-\frac{\text{Rel}_{2}}{\text{Rel}_{1}})} \)
This is a somewhat ugly expression, but it is important to note that all the values on the right hand side of the equation are knowns: the source-image distance (SID) was measured for the first image, the distance the source was brought back (y) was measured, and the relative sizes of the object (\(\text{Rel}\)) are measured on the images. If your x-ray tablet is like mine, you could make a quick Excel spreadsheet to do this calculation for you with the measured values and get depth perception to your item.
There are, of course, limitations: if some element in the x-ray image completely blocks another thing, then naturally there is no way to see it from that angle. For this technique to work we need at least enough x-ray penetration to see through to the panel. It is also a more cumbersome and unclear way than getting alternate angles. However, in a pinch, depth perception for known and unknown sized objects is possible from a single axis shot.
Given that improvised explosive devices can be made in as many ways as the bomb maker can imagine, it is useful to try and breakdown what components make up an IED. A few acronyms get used regularly: PIES, SPICE, and PIECES are the most common ones.1 They are broken down as:
PIES: Power Source, Initiator, Explosives, Switching
SPICE: Switching, Power Source, Initiator, Container, Explosives
PIECES: Power Source, Initiator, Explosives, Container, Enhancements, Switching
The bare minimum is given by PIES since containers are not strictly necessary and not all IEDs have enhancements. What is needed for an IED is an explosive as the main charge (or it is not really an explosive device), an initiator for that explosive (or it cannot initiate), a switch that triggers said initiation, and a power source to give the initiator the energy needed to fire.
Whilst most IEDs are electrically initiated and hence the power source is often a battery, sometimes people say that power sources are not strictly necessary because non-electric initiation is possible. Whilst it is true that power source and battery often gets used interchangeably, the power source is whatever gives the initiator the required energy to commence the explosive train and function the device.
This means that to understand what a power source can be, we need to understand what kinds of initiators are available to the would-be IED maker. Again, the majority of IEDs are electric, so the power source is going to provide some kind of electricity, such as a battery, solar panel, capacitor, or mains power.
But not all IEDs are electrically initiated. In the realm of non-electric initiators, there exist flame/spark initiators (like the classic safety fuze non-electric detonators), impact based ones (for instance, slapper detonators), friction based (like matches), stab (used in cocked striker fuzes), and percussion initiators (most commonly percussion primers for small arms rounds).
Importantly, all these kinds of initiators need some kind of energy to initiate. In conventional munitions the energy for stab detonators can be stored in the form of a striker spring and the reason that cocked striker fuzes are so dangerous is that the power source (mechanical tension in a spring) can so easily fire the detonator if set free.
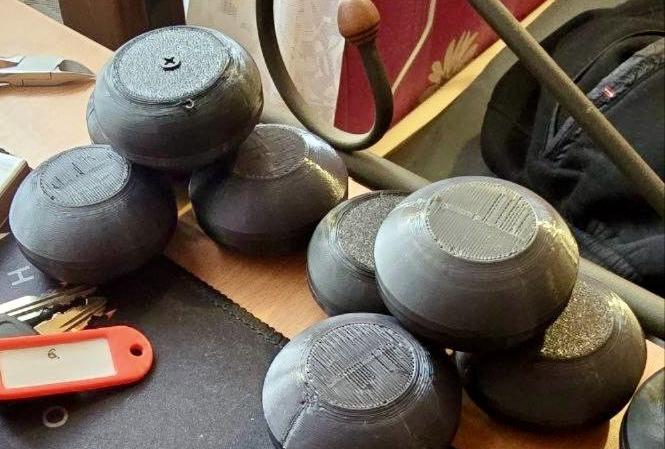
Mechanical spring tension in a spring is probably the most obvious non-electric power source, but sometimes there really does not appear to be a power source in a device. For instance, below are so-called “gingerbread” mines seen in Ukraine. It consists of a 3D printer container with some plasticised explosive, a screw and a detonator. When the victim steps on the mine, it flattens the container, making the screw hit the detonator and functioning the device.
The explosive and initiator are obvious. The switch is the screw pushing into the detonator. Where is the power source? The answer is that the victim is the power source. If nothing pushes that screw into the detonator capsule, there is no detonation. In other words, unlike other kinds of devices where the power source is integral to the device, the victim gives it the energy to function.
The point that makes this whole description make sense is that initiators cannot function by themselves. They need an activation energy to function. Something has to give it that energy. For some improvised devices and munitions, this energy comes from the target exerting a force.
This is different to a pressure plate where the victim is merely connecting the power source (typically a battery) to the initiator. Not all victim operated devices have the victim as the power source since most of them use the victim to function the switch, which in turn connects a separate power source to the initiator to initiate the device.
If you tried to argue that the gingerbread mine does not have a power source because it is not part of the device, then you would also have to concede that the device is neutralised by design since it cannot function by itself. Similar to if a long command wire IED was designed to fire by connecting a battery to loose ends a the firing point, you would say that the power source was not connected, but you would concede that there is a power source as part of the whole functioning device.
For some conventional munitions with impact fuzes functioned by hitting the target, the power source is the kinetic energy built up by being dropped/launched and the energy is imparted to the initiator when the munition impacts the target. If for whatever reason the impact fuze did not hit a target, then it would revert to needing some external power source to function it. This is why movement is a hazard for impact munitions: movement can supply energy.
To conclude on the main point: all initiators need energy to function and that energy has to come from a power source. All IEDs are designed to function, so all IEDs have some kind of power source by design. If that energy comes from the victim, the victim is the power source.
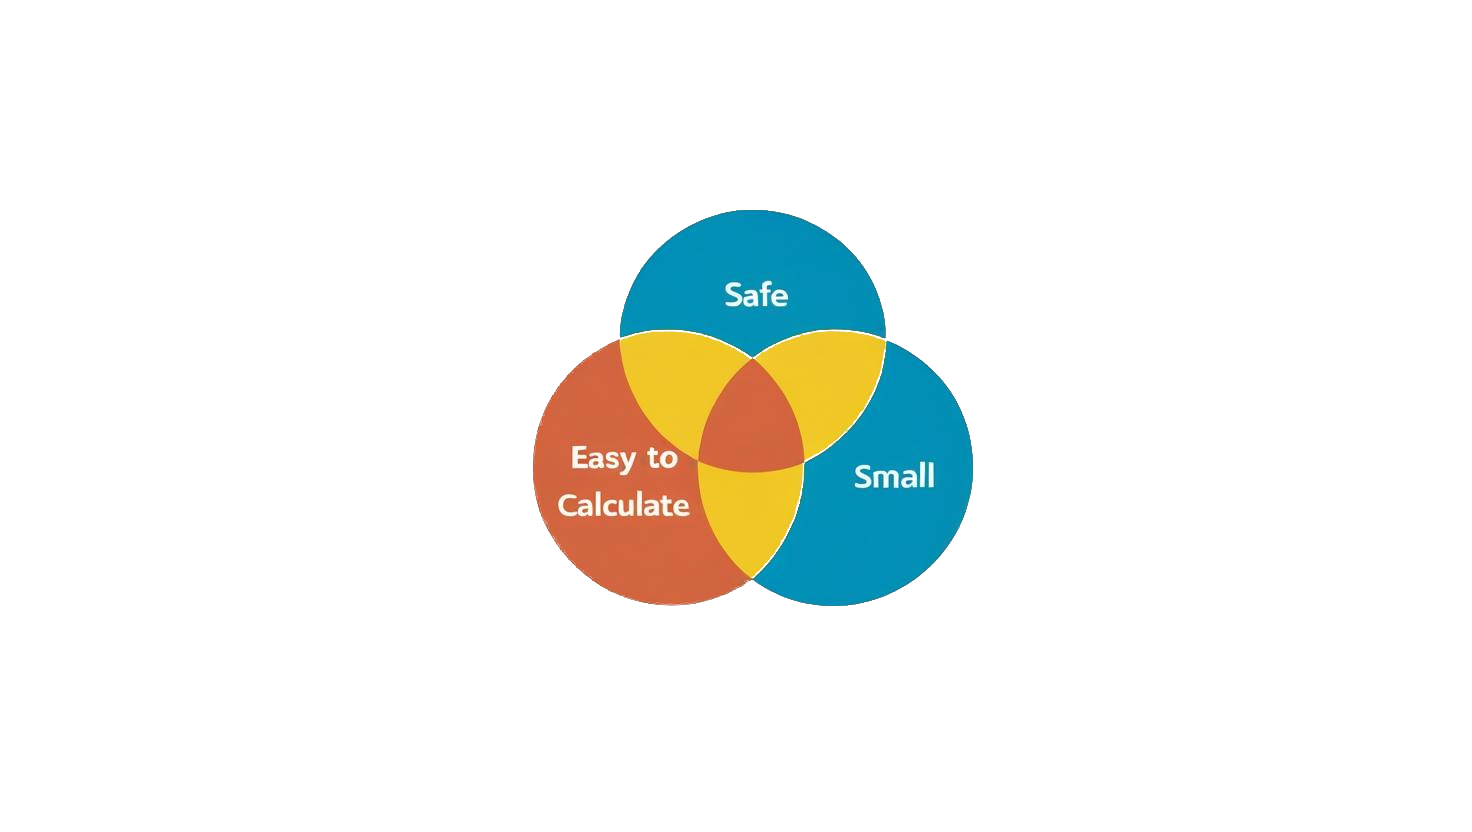
For safety calculations to be done in the field, we need to balance ease of calculation with actual minimum safe distances. We can always use naïve equations that create enormous safety ranges which, whilst safe in the sense that there is no risk from blast or fragmentation from the munition/device in question, are too burdensome a requirement to actually be employed. To exaggerate the point, a blanket 10 km safety distance for all non-nuclear explosions is safe and easy to calculate, but it is not the minimal safe distance. We want our safety distances to be in the centre of our Venn diagram – easy to calculate, safe, and small. The more resources we have to do the calculation, the less important ease of calculation is, but we always want it to be as safe and small as possible.
There are three factors that make a calculation “easy”. First, it should involve simple enough maths, and secondly not too much of it. The calculation can neither require advanced mathematical ability nor extensive arithmetic. The third and perhaps most important factor is that we need to be able to actually estimate the relevant parameters that go into the equation. It is of no use to have a simple, accurate equation that we cannot figure out the inputs for.
That being said, it is worth considering whether sometimes we can go for the gold solution of computer-aided modeling and provide EOD technicians the resources to use these models in the field. Whether it be through an equation, a table, or inputting some parameters into a computer, at some point the EOD technician must decide what the risk is for blast and fragmentation damage is at different distances. In the modern world, computer resources are often not too far away. Depending on the level of detail in the model, EOD teams could arrive at much more precise figures that accurately represent blast propagation through urban and natural structures as well as the fragmentation throw through this cover.
There are three levels I propose for the accuracy in a explosive safety distance calculation depending on the amount of parameters considered:
Level 1: The Naive Calculation
At Level 1 we only consider the TNT equivalent net explosive quantity (NEQ) and ignore the issues surrounding TNT equivalency (discussed here) for blast, ignore any level of detail of explosive properties when it comes to fragmentation, any consideration of the casing or type of frag, and terrain.
This calculation is easy in the sense that the maths is relatively straightforward; plug the NEQ into the equation and out comes a safety distance. But the lack of input parameters means some very important factors are forgotten about and hence to be safe, significant over-estimation is baked into the equations. For example, a calculation that treats a submunition and a hand grenade of similar NEQ as the same kind of object is clearly going to need to over-estimate the effects of the hand grenade. It is obvious that a munition designed to be employed at the range it can be thrown by a human must have a smaller hazard zone than one designed to be dropped from an aircraft.
When extreme expedience is required this level of calculation makes sense. The big benefit is that only one table is required: NEQ as an input and any number of safety distances as output, so in the context of an assault it may be acceptable to ignore other relevant factors. In this case, the NEQ is likely to be an estimate anyway, and the output safety distance is very rough. Where this is acceptable, a Level 1 calculation makes the most sense.
Other calculations may involve slightly different inputs. For example, the International Mine Action Standard has a calculation for safety distances based on “All Up Weight” which includes both explosive and casing/fuzing weights.1 This calculation is derived partly from Gurney calculations (mentioned below) and experimental results.
Level 2: The Detailed Calculation
The next level up involves considering the initial velocity, number and type of fragmentation pieces to calculate their spread. This Level 2 calculation is not a single calculation methodology but encompasses all the cases where multiple input parameters are used to understand the propagation of blast and frag.
Blast continues to be relatively straightforward if we assume flat terrain and an explosive quantity calculation of some kind is likely appropriate in open areas. As was mentioned in the TNT equivalency post, I have reservations about using a TNT equivalency factor to equate different explosives, but even an NEQ based calculation has merit.
Fragmentation is where it gets more detailed. This is the more important part too as fragmentation safety distances are typically larger than blast ranges – up to around 5000 kg NEQ according to the Australian eDEOP 101.2 For an effective fragmentation calculation, figure out what kind of fragmentation we will get when a munition explodes, we use the Gurney model to calculate the initial fragment velocity and combine it with a drag equation to understand how much drag the fragment will experience. Then the last step is the trickiest one: accounting for the actual trajectory.
The reason the last step is the hard one is that it is technically solving a differential equation for each piece of frag and needs to include the terrain – after all, a bomb that explodes on a hill will have frag that travels further than on flat ground or in a gully. What we can do to skirt around this challenge is to average the drag over the flight of the fragment to a single value and then calculate how far it will travel before it loses so much energy that it ceases to be hazardous. The eDEOP 101, in line with NATO and based on trials by the United Kingdom, has determined that the hazardous fragmentation distance is where there is less than 5% risk of a hazardous fragment (79 J kinetic energy or greater) hitting per 56 m\(^2\). That is 600 ft\(^2\) if you were wondering why it is not a round number.
I will go into more detail on how to actually do this calculation – or my preferred version at least – but the steps are as follows:
Figure out what the fragments will be like, specifically weight, shape, and number.
Figure out how fast they will go initially (using the Gurney model).
Figure out how much drag the fragments will experience.
Figure out at what distance they will fall below the threshold for risk.
Level 3: Computer-Aided Models
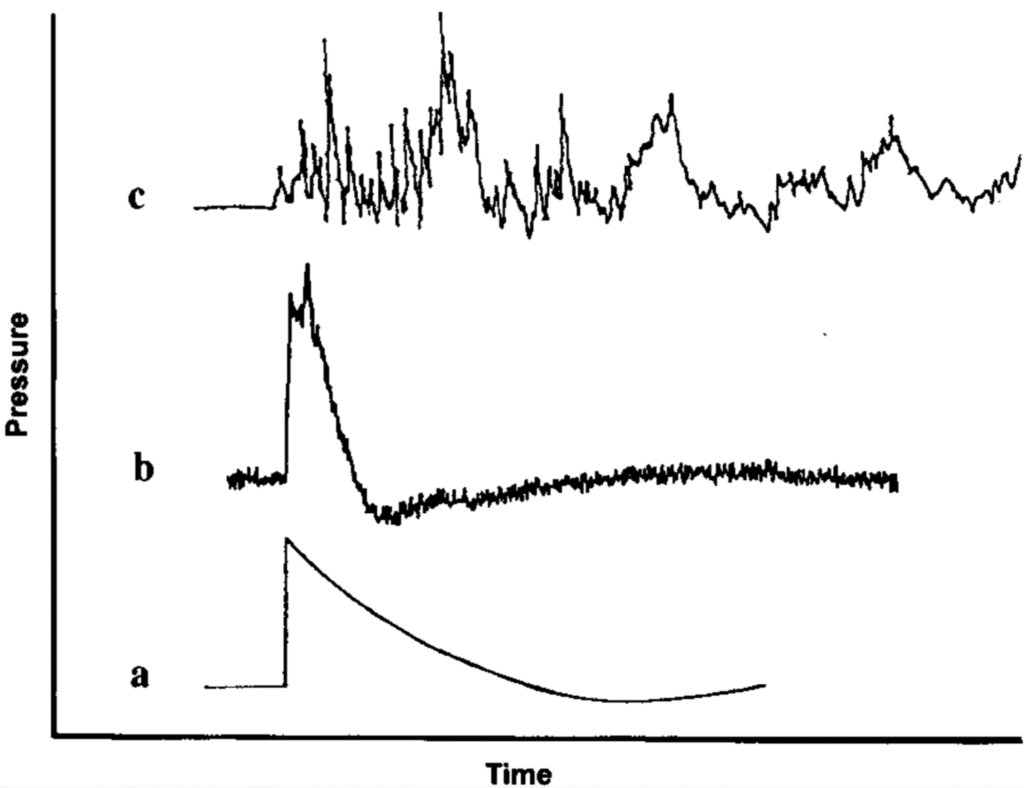
The final level is using a computer to aid in blast and fragmentation modelling. This level covers the whole range of options from a process similar to the one described for Level 2 where the computer is used to solve those equations, including the differential equation, to one where the terrain is modeled and more accurate blast and fragmentation calculations can be done. With regards to blast in particular, the idealised calculation can be dangerously inaccurate in complex environments, as can be seen in the figure below.
Blast waves at different distances can vary a great deal from the ideal case in free space (a) to one where there is reflections off the ground (b) to a more complex environment (c).3
On some accounts, the reflection from the ground in a surface burst doubles the effective NEQ.4 Even in an environment with just a single vertical surface to reflect off, the blast wave can have significantly different survivability. The figures below show just how dramatically more the blast wave lethality is when beside a wall.
Note that these are log-log plots. The curves for survival-lung damage are shifted to the right in the case with reflection off a wall, indicating that damage would occur at a further distance from the point of detonation in the presence of a reflecting surface.5
All of this is to emphasise that, other than simple devices like double the effective NEQ for ground burst or a simple factor for standing near a wall, blast propagation calculations need computer assistance to model their effects accurately. Once again, whether this level of detail is helpful depends entirely on the situation, however, with computational resources becoming ever more common, it is a worthwhile tool to include.
Complex blast propagation software is outside the scope of this post, but some simpler resources based on the Kingery and Bulmash methodology is available from GICHD on request as an Excel file, or another version is available from as a Python package from Github here. This model does not consider terrain however it does more accurately model blast waves than a simple polynomial.
For fragmentation, similar software exists which automates the Level 2 calculation and does not need to take the trajectory shortcut that we took of averaging out the drag coefficient. Terrain analysis can similarly be incorporated.
The level of detail that is gone into when doing calculations will depend on the available resources, the ability to estimate the input parameters, the time available and the required accuracy. Whilst the real world varies significantly from simple single-input formulas, a relatively safe and quick estimate of safety is often all that is required, so it is also worth asking whether a safety distance with less fudge factor is worthwhile.
Probably the most important fact to know about a shock wave is that it is the same kind of wave as a sound wave. When you hear a sound, what you are hearing is the pressure of the air going up and down in some pattern particular to that sound. This pressure gets to your ear by means of a pressure (or sound) wave, whereby the pressure of one bit of air pushes the next bit of air, bunching it up until it pushes the next bit of air, up until your ear.
Shock waves match this description, so are in that sense, sound waves. What makes them special is that shock waves go faster than the speed of sound. It is worth asking the question: how does a shock wave go faster than a sound wave?
The speed of sound in a material is set by its stress-strain characteristics: when a relatively small pressure is applied to a material (ie it is stressed), it causes a strain which is reversed when the stress is removed. So when a pressure wave moves through the material, the stress it imparts does not cause any deformation. This is called “elastic” behaviour and the elasticity in this sense of a material is what dictates the speed of sound.
The louder the sound, the higher the pressure from the pressure wave, but as long as it is in that elastic region of the stress-strain characteristics of the material, then it will remain at the speed of sound. It is perhaps a little odd to think that quiet and loud noises are both travelling at the same speed, but it is true.
What makes shock waves special is that they cross past that elastic region into the plastic region. This graph from the post “Waveshaping: More Shock for Your Waves” shows the different regimes a pressure wave can travel in:
In this figure, sound waves exist purely in the linear region on the left, the elastic region. Shock waves of the kind we care about with explosives are in the shock regime where the behaviour is plastic, though there is an intermediate area where plastic-elastic combination effects are seen.
So what makes shock waves special is that they have pressures above the elastic limit and hence can travel faster than the speed of sound. There is an interesting and important consequence of this defining fact: shock waves are discontinuities in pressure. Since by definition the shock wave can only exist past the elastic limit, the front of the wave cannot gradually increase in pressure like a sine wave; the shock wave front is a discontinuous jump from ambient pressure to the shock pressure. For as long as there is enough energy to maintain the shock wave, its front is square.
Perhaps this explanation of how shock waves travel faster than regular sound waves is not yet satisfying because it does not explain why the shock wave speed can go faster in the plastic vs elastic regimes. In a sense, shock waves travel faster because they are a combination of the speed of sound and the particle velocity, which is now unconstrained from the need to return to rest elastically.
It turns out that the special behaviour of shock waves compared to sound waves comes down to the discontinuity. The jump from ambient to shock pressure happens along a different pathway to the gradual increase in pressure and so the work that is done is different after the wave passes through; this is why explosives have brisance and loud speakers do not. But fundamentally, a shock wave is just a faster sound wave.
When we use explosives, there are two features that military engineers leverage in particular: the blast and brisance. The blast effect is used to “push” and the brisance effect is used to shatter. Blast effects are carried out by the large volume of hot gases that expand out from the explosive so using a large volume of explosive makes a lot of sense for optimal blast.
Brisance is generally understood to be more closely tied to the shock wave. But the emphasis in most people’s understanding is that it is a shock, and the fact that it is a wave is not well leveraged. Specifically, one of the defining features of waves is their ability to constructively and destructively interfere with each other, and this effect can be leveraged to enormous effect with shock waves.
Regular pressure waves are just sound waves, and when you add them up, the resulting pressure is the sum of the sound wave pressures. This is because sound wave occur in the elastic region of the stress-strain curve which is linear; when a molecule is disturbed by a sound wave, it returns to its original state as if it was attached to a nice little spring.
Shock waves are not so linear. When a shock wave travels through a material, the compression is so high that the material acts more like a fluid being deformed like plasticine. The molecules are therefore not bouncing back to where they were as if attached to little springs. This non-linearity means that when two shock waves collide, they do not sum in the way that sound waves do – the collision of shock waves yields a higher pressure than the pressures of the individual shock waves.
The idea that shock waves collide and result in a larger pressure than the sum of the individual pressures is the crucial point. If you want to understand a little bit more about why, the basic idea is that materials are shocked to points along a curve called a Hugoniot. The Hugoniot for a particular material describes the allowable states behind a shock wave so when two shock waves collide, their Hugoniot curves must intersect.
The figure below shows two shock wave Hugoniots (the ones going right are in blue, the ones going left are in green) and you can see that they intersect at a particle velocity of v = 0 with a huge pressure spike. This same concept applies to two shock waves of different particle velocities also, though the intersection will naturally shift.
Pressure vs particle velocity plot for two colliding shock waves. If the shock waves summed linearly like sound waves do, the intersection would be at 2.94 GPa (the sum of the two shock wave pressures), and is instead much higher at 13.76 GPa. The plot above is for shock waves in aluminium.
This fact about shock wave collisions leads to an important tool in our tool kit: if we can use explosives in a carefully determined arrangement, we can shape the shock waves to collide in ways that will maximise our desired effect.
As we mentioned earlier, the effect that is going to be altered by creating higher pressure shock waves is the shattering effect. If we would like to shatter a material at a specific spot, wave shaping tools can be used to collide shock waves at that specific spot using much less explosive than would be required with bulk explosive techniques. All you need is a way of producing and transmitting shock waves so that they collide at a point or points of your choosing.
If before the way to increase the shattering effect was to add more explosive, now you have the opportunity to be more creative with how that explosive is used to create a disproportionate effect. What is important with waveshaping is that we configure the explosive train and initiation carefully in order to be confident where the shock waves will meet, and as part of that, use inert materials that area able to stop shock waves from travelling through the waveshaping material to disrupt the carefully configured explosive train. In other words, if we put a disc of wood in between two layers of sheet explosive but the wood is too thin for the thickness of sheet explosive, it is not inert enough as a waveshaper.
Perhaps the simplest model is one where an inert disc is used as in the figures below from DSTO (now DSTG) in Australia, and the shock waves converge to a point cylindrically at the bottom.
These figures are taken from “Diagnostic Imaging of Detonation Waves for Waveshaper Development”, DSTO, 2009 (link from National Library of Australia here).
Other arrangements which generally conserve a “round” kind of symmetry allow for different convergence geometries, like converging on a disc. The important thing is that pressures far in excess of the detonation pressure of an explosive can be achieved by colliding shock waves. Just as importantly for military engineers, this can be achieved to a high standard under field conditions with readily available resources. You do not need your 3D shock waves to perfectly collide at a point to achieve an effective pressure multiplier from “near enough” collision.